GA4 Traffic and Analytics Dashboard Built for Agency Reporting
Google Analytics 4 is powerful but complicated. Zensor connects directly to your clients' GA4 properties and translates the data into clear, visual dashboards showing traffic trends, engagement quality, conversion paths, and audience behavior, without any GA4 expertise required.
GA4 Made Reporting Harder for Every Agency
The migration from Universal Analytics to GA4 disrupted every reporting workflow agencies had built over years. GA4 is more powerful as a platform, but the interface is less intuitive, default reports are harder to read, and extracting the same insights that were one click away in UA now requires custom explorations or Looker Studio buildouts.
Your clients have not changed their expectations. They still want clear answers: is my traffic growing, where are visitors coming from, and are they converting? Building a custom dashboard per client takes 2 to 4 hours each, requires ongoing maintenance, and still leaves SEO context completely disconnected.
3 to 5 Clicks Deep
Basic metrics that were one click away in Universal Analytics now require multiple steps and custom explorations to find in GA4.
Custom Dashboard Tax
Building a Looker Studio dashboard per client takes 2 to 4 hours each and requires ongoing maintenance every time GA4 changes.
No SEO Context
GA4 traffic data has no SEO layer, so when traffic changes your team cannot tell whether it was a ranking shift or a content issue.
Metric Confusion
Session-based and event-based metrics are not directly comparable, creating constant confusion in client conversations and reviews.
What Is Zensor's GA4 Analytics Dashboard?
Zensor's GA4 analytics dashboard is a simplified reporting layer that connects to your clients' Google Analytics 4 properties and organizes traffic, acquisition, engagement, conversion, and audience data into pre-built visual dashboards. Agencies use it to produce client-ready GA4 reports in minutes rather than hours, and to combine traffic data with SEO performance in a single unified view.
Key Capabilities
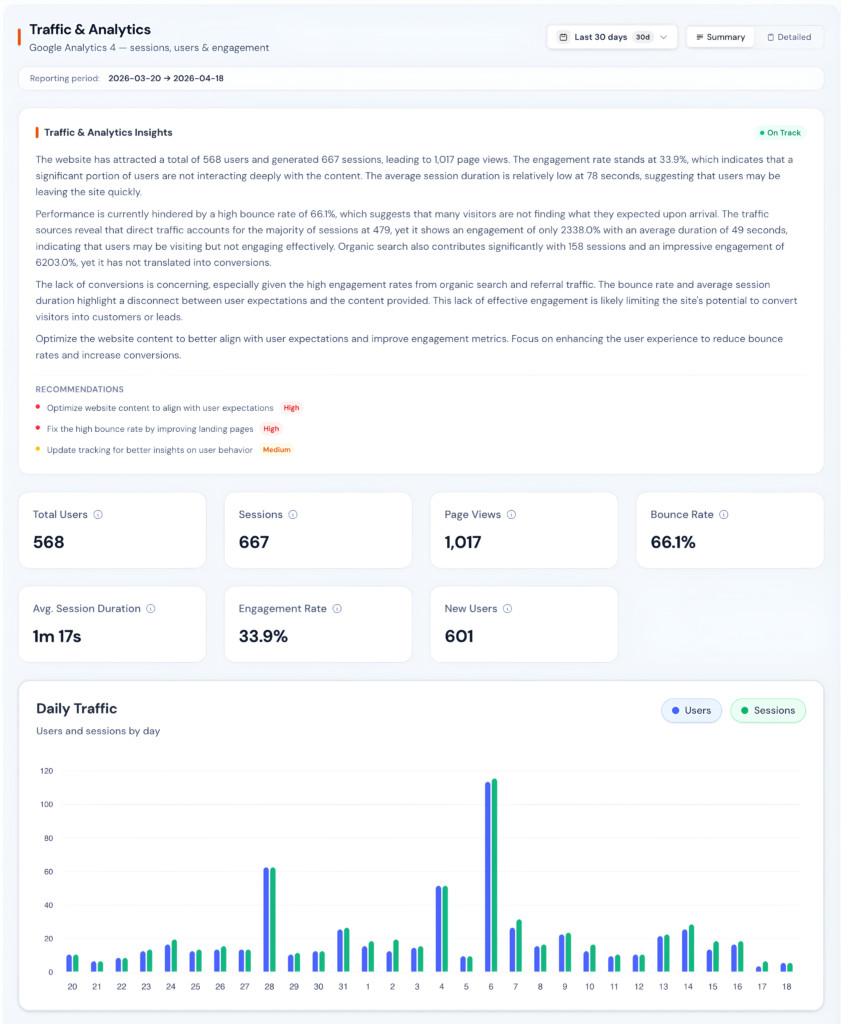
1 Unified Traffic Overview
See all your key GA4 traffic metrics in one view without navigating GA4’s nested menus. Zensor pulls sessions, users, new users, and engagement rate into a single dashboard with trend lines and automatic period comparisons.
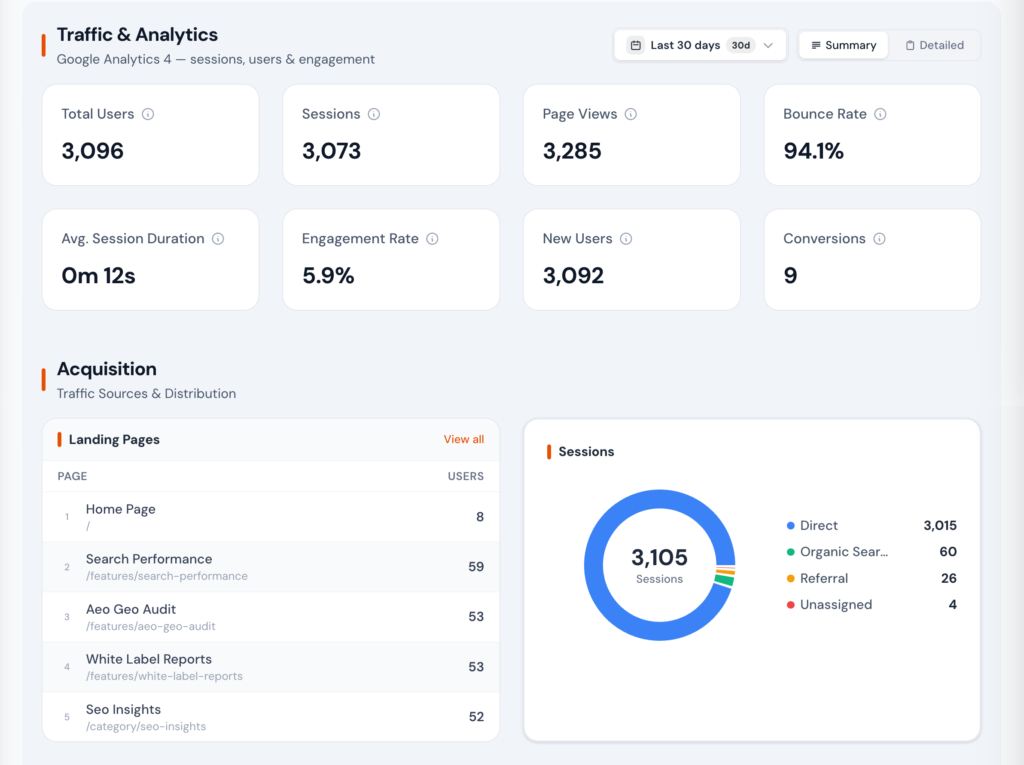
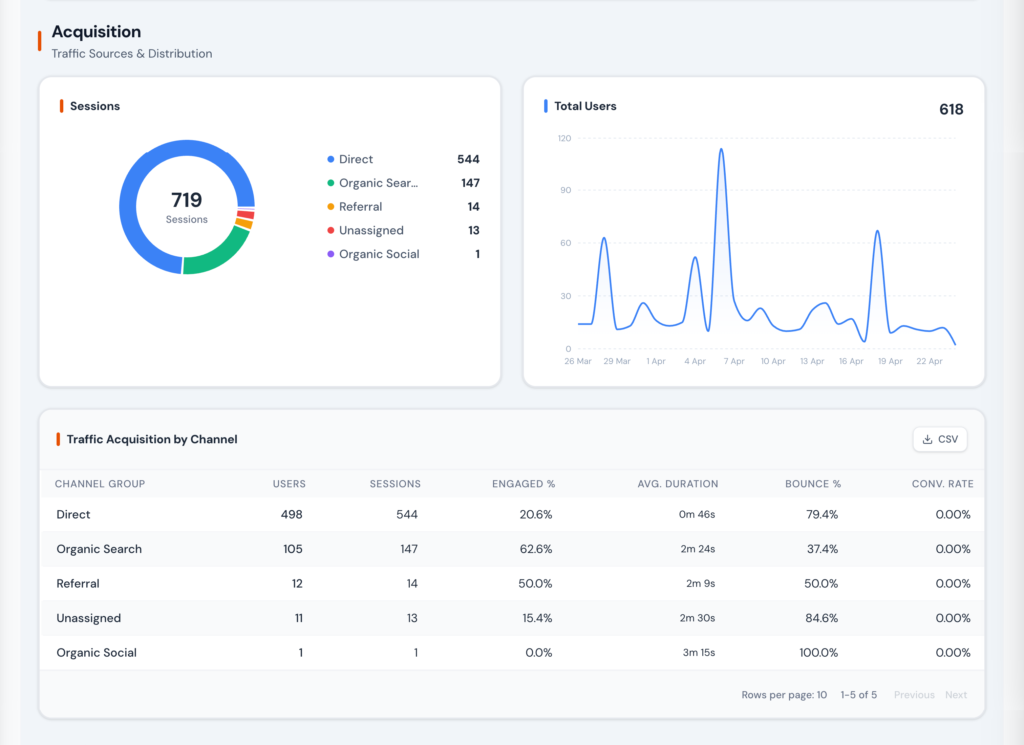
2 Acquisition and Channel Analysis
Understand where traffic comes from and which channels are growing or declining. Zensor maps GA4 default channel groupings and lets you view source and medium breakdowns without building custom explorations.
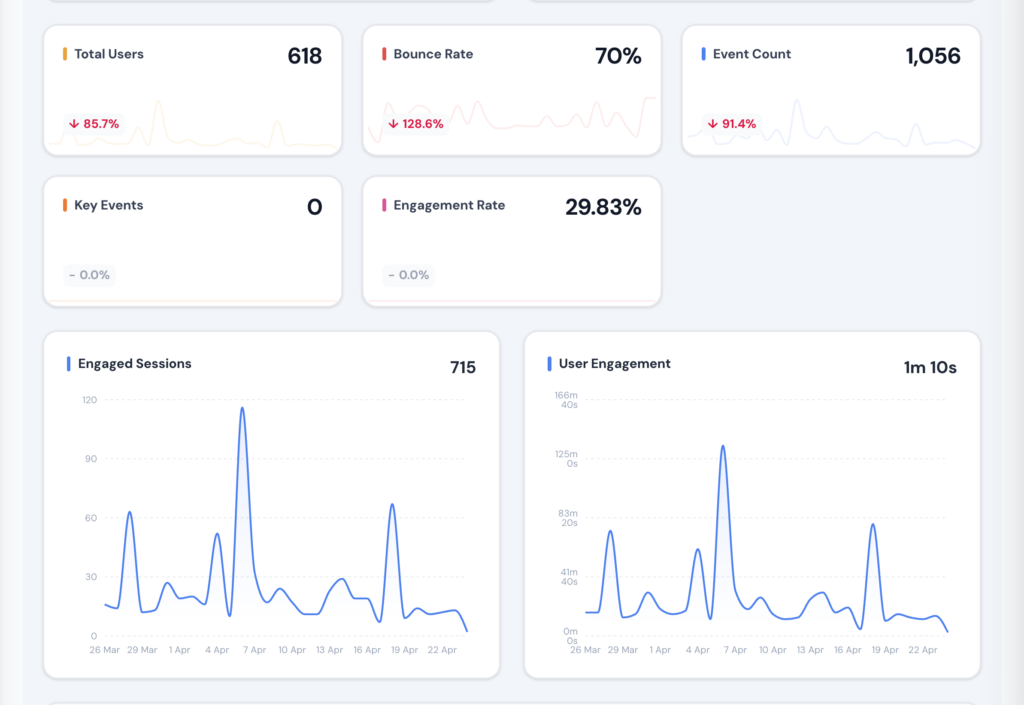
3 Engagement and Behavior Insights
Go beyond pageviews to see how users actually interact with your client sites. Zensor surfaces GA4 engagement events in readable cards so you can understand content performance and user intent.
4 Conversion and Goal Tracking
Connect SEO and traffic work to business outcomes. Zensor pulls GA4 conversion events into a dedicated dashboard showing which pages, channels, and campaigns drive results.
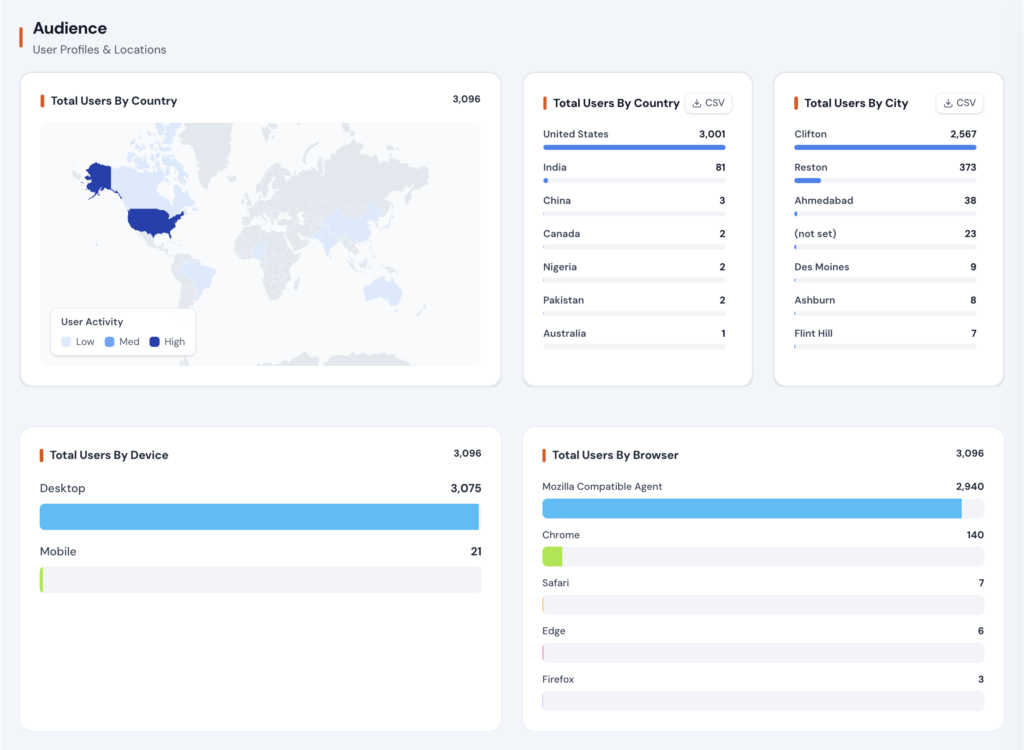
5 Audience Intelligence
Know who your visitors are, not just what they do. Zensor surfaces GA4 demographic and technology data to help agencies make smarter content and targeting recommendations for clients.
How It Works
Step 1: Connect GA4 Properties
Authenticate with Google and select each client's GA4 property. Zensor uses read-only access and never modifies analytics configuration. Setup takes under 2 minutes per property.
Step 2: Data Syncs Automatically
Zensor pulls GA4 data daily and imports up to 16 months of historical data on first connection. You have full year-over-year comparison capability from day one.
Step 3: Explore Pre-Built Dashboards
Browse the traffic overview, acquisition, engagement, conversions, and audience dashboards. Every view is designed for clarity. No GA4 expertise or custom setup required.
Step 4: Include in Client Reports
Drag GA4 widgets into white-label client reports. Add AI-generated commentary that explains what the numbers mean in plain language. Deliver as PDF or share a live dashboard link.
Zensor vs Alternatives
| Capability | Zensor Your Solution | Screaming Frog | Sitebulb | SE Ranking |
|---|---|---|---|---|
| Pre-built traffic overview | Build custom |
|||
| AI-generated commentary | ||||
| Period comparison built in | Manual setup |
|||
| Combined with GSC and CWV data |
Yes (native) |
Partial |
||
| White-label client reports | Partial |
|||
| Historical import (16 months) | ||||
| Conversion path analysis |
Yes, automated |
Complex |
Manual |
Basic |
| Setup time per client |
Under 2 minutes |
N/A |
2 to 4 hours |
30 minutes |
Who This Is For
Agency Owner
"You manage 15 clients and your team spends two days a month building GA4 reports in Looker Studio. The reports look different depending on who built them."
Zensor auto-generates consistent GA4 dashboards for every client. Your team spends time reviewing and adding context instead of building reports from scratch. Two days of work becomes two hours.
SEO Manager
"A client asks why organic traffic dropped 20% this month. You need to cross-reference GA4 traffic data with GSC ranking changes to find the answer."
Zensor's unified dashboard shows GA4 traffic alongside GSC performance in one view. You identify that a core page lost both rankings and traffic simultaneously after a content update. Root cause found in minutes.
Client Services Lead
"Your client does not understand GA4 reports and keeps asking what the numbers mean. Your account manager spends 30 minutes on every call explaining basic metrics."
Zensor's AI commentary translates GA4 metrics into plain language. The client reads that organic traffic grew 12% this month, driven by three blog posts that moved to page one, instead of staring at an event-based data table.
Frequently Asked Questions
No. Zensor connects to your existing GA4 property using read-only access and reads the data. You keep full GA4 access and functionality. Zensor adds a simplified reporting and visualization layer on top, making GA4 data easier to understand and share with clients.
Zensor imports up to 16 months of historical GA4 data when you first connect a property. This gives you full year-over-year comparison capability from day one, without waiting for data to accumulate.
Yes. That is one of Zensor’s core strengths. The unified dashboard shows GA4 traffic and engagement data alongside GSC search performance data, so you can see the full picture from impressions and clicks through to on-site engagement and conversions.
Yes. If a client’s GA4 property has e-commerce events configured, Zensor pulls revenue, transaction count, and product-level data into dedicated e-commerce widgets that can be included in client reports.
Zensor uses read-only OAuth access granted through Google’s standard authentication flow. We never modify your GA4 configuration. All data is encrypted in transit and at rest. You can revoke access at any time from your Google account settings.
Universal Analytics stopped processing data in July 2024. Zensor is built for GA4’s event-based data model. If a client still needs migration support, our onboarding documentation includes guidance on completing the GA4 setup before connecting to Zensor.
Make GA4 Easy for Your Entire Agency
Stop rebuilding GA4 dashboards from scratch for every client. Zensor connects in minutes, auto-generates client-ready analytics views, and keeps your team focused on strategy instead of reporting.