Google Search Console Dashboard for Agencies Managing Multiple Clients
Google Search Console gives you the data. Zensor makes it actionable. View keyword rankings, click performance, impression trends, and page-level search data across every client property in one place, without switching between GSC accounts all day.
GSC Is Built for One Site. Agencies Manage Dozens.
Google Search Console is one of the most valuable tools in any SEO workflow. The data it provides, clicks, impressions, average position, and click-through rate, comes directly from Google. The problem is that GSC is designed for one property at a time. Every time you want to check a different client, you switch accounts, navigate the property, and start the same workflow over.
For an agency managing 20 or 30 clients, this means constant context-switching, missed trends, and insights that fall through the cracks. A keyword that slipped from position 8 to position 12 overnight goes unnoticed until the client calls asking why traffic is down.
One Property at a Time
Every client check requires switching accounts, navigating the property, and restarting the same workflow from scratch.
No Portfolio View
There is no way to see ranking trends and search performance across your entire client base in a single unified view.
Silent Ranking Drops
Important keyword movements go completely undetected without daily manual checks across every client property.
Missing Analysis Layer
GSC has no built-in cannibalization detection, opportunity ranking, or cross-property data export for agency reporting.
What Is Zensor's Search Performance Dashboard?
Zensor’s Search Performance Dashboard connects to Google Search Console via the official API and consolidates clicks, impressions, average position, and CTR data for all client properties. It adds automated opportunity detection, ranking alerts, keyword cannibalization detection, and competitor comparisons, turning raw GSC data into multi-client search intelligence for agencies.
Key Capabilities
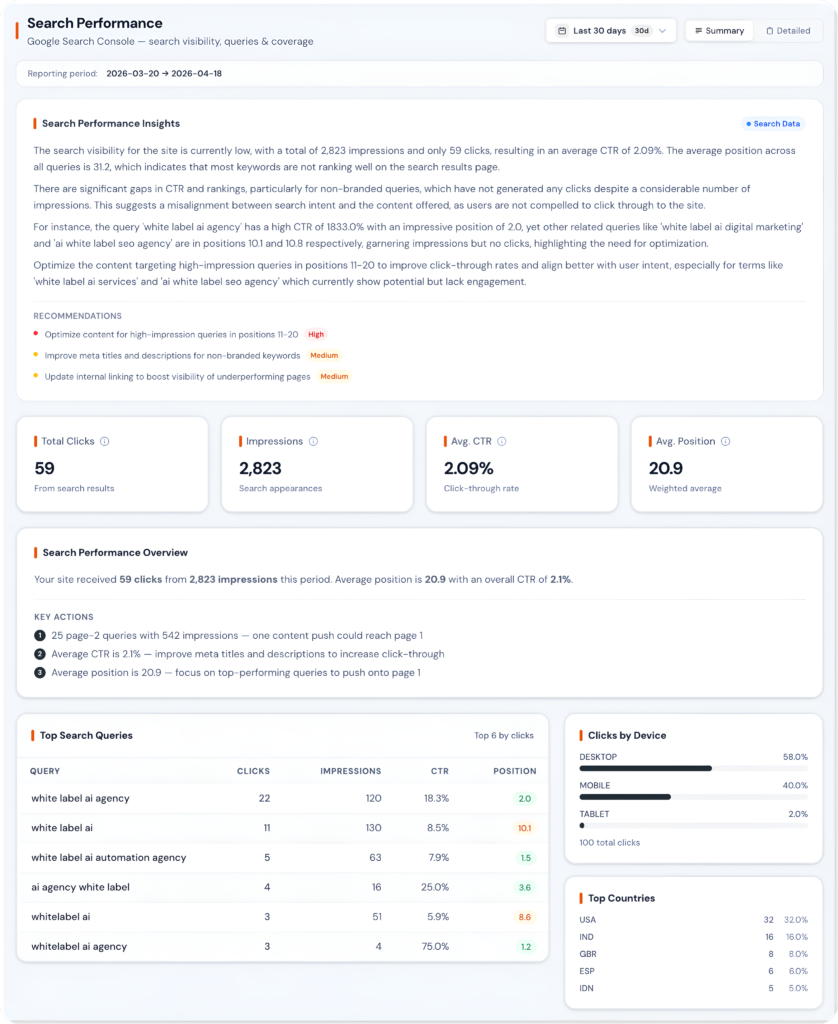
1. Multi-Property GSC Overview
See search performance across every client in one view. Zensor surfaces the metrics that matter at the portfolio level so you can identify which clients need attention without opening a single GSC property.
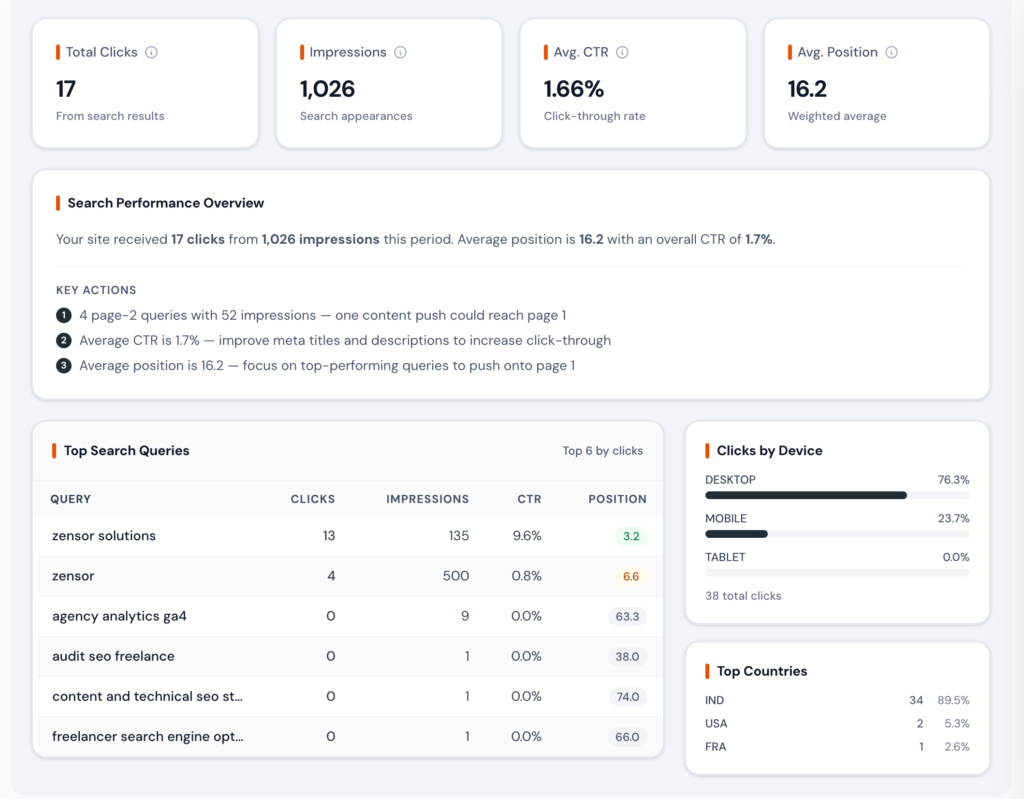
2. Keyword and Ranking Insights
Go deeper than the GSC default views. Zensor organizes keyword data so you can find opportunities, detect drops, and understand which queries drive real business value for each client.
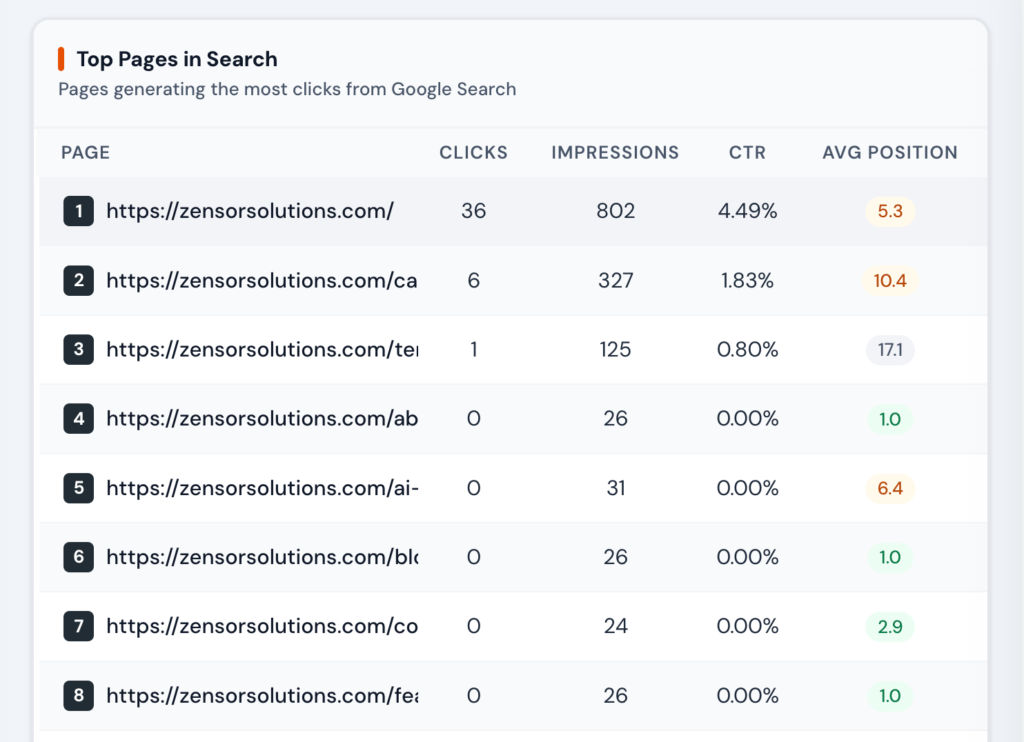
3. Page-Level Performance Analysis
Understand how every page on your client sites performs in search. Zensor shows which pages attract impressions, which convert clicks, and which are underperforming relative to their ranking positions.
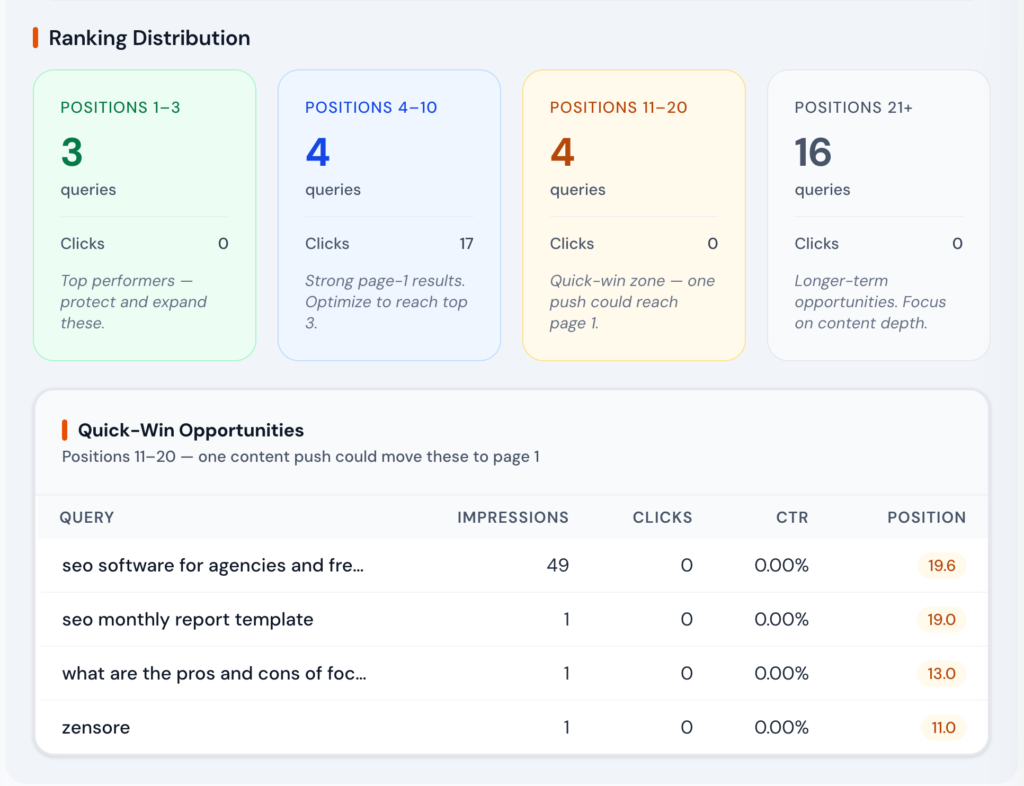
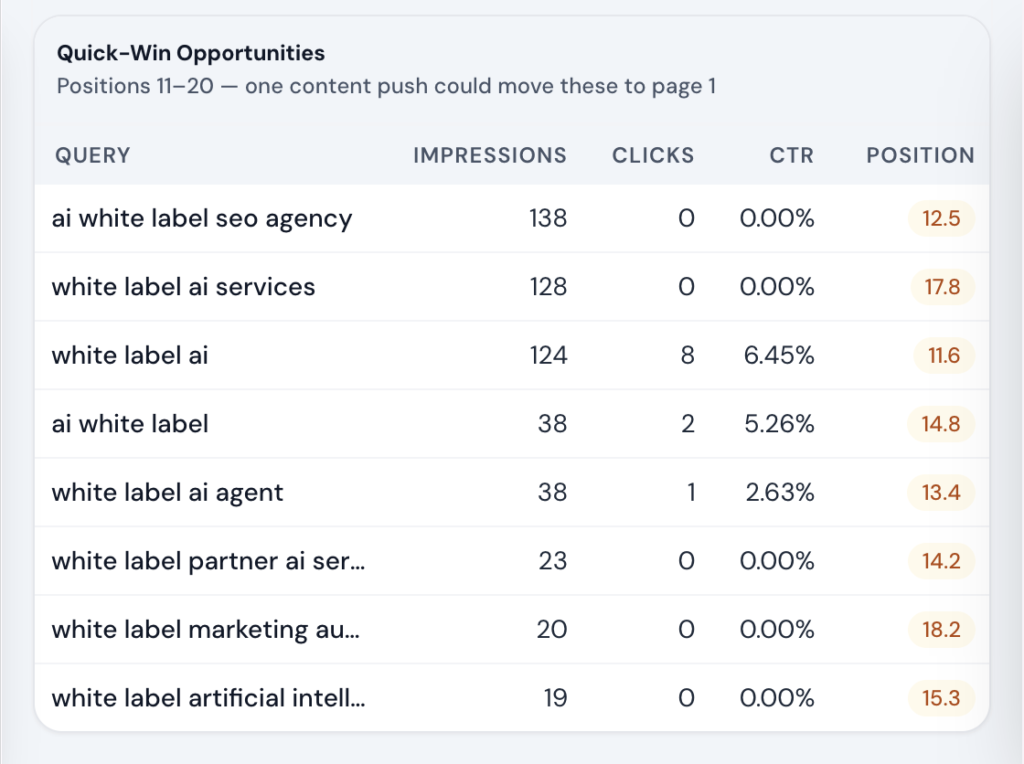
4. Ranking Opportunity Detection
Zensor analyzes GSC data and automatically surfaces the ranking opportunities with the highest potential ROI. Your team sees the opportunities that manual review would miss.
5. Automated Search Performance Alerts
Ranking changes happen continuously. Zensor monitors GSC data daily and alerts your team when something significant changes so you can respond before rankings drop further.
How It Works
Connect GSC Properties
Authenticate with Google and select each client’s GSC property. Zensor instantly imports up to 16 months of search data, with setup taking under two minutes per property—no code or API configuration required.
Review Search Performance Dashboards
Browse the portfolio overview to identify high-activity clients and those needing attention. Open any property to view keyword rankings, page performance, and automated opportunity insights.
Act on Ranked Opportunities
Review the opportunity queue to find quick wins, CTR improvements, content gaps, and cannibalization issues. Each item links to the affected pages and keywords with clear next-step recommendations.
Include in Client Reports
Add GSC data widgets to white-label client reports. AI-generated commentary explains ranking trends, and automated scheduling delivers updates to clients without manual reporting.
Zensor vs Alternatives
| Capability | Zensor Your Solution | Screaming Frog | Sitebulb | SE Ranking |
|---|---|---|---|---|
| Multi-property unified view | Partial |
|||
| Quick win opportunity detection |
Yes, automated |
Partial |
Partial |
|
| Keyword cannibalization detection |
Yes, automated |
|||
| CTR optimization recommendations | ||||
| Combined with GA4 in one view |
Yes (native) |
Partial |
||
| Daily ranking change alerts | Yes (paid add-on) |
|||
| White-label GSC reports | ||||
| 16-month historical data | Partial |
Who This Is For
Agency Owner
"You want a Monday morning view of which client sites had significant ranking changes over the weekend without logging into 20 separate GSC properties."
Zensor's portfolio overview surfaces the top gainers and losers every week in one screen. You see which clients need immediate attention in 5 minutes, not 2 hours.
SEO Manager
"A client's organic traffic dropped 15% last month. Rankings appear stable in your tracking tool, but you suspect the issue is CTR, not position."
Zensor’s GSC dashboard reveals CTR on the client’s top pages dropped from 4.2% to 2.8% after a title tag change. You identify which titles to revert or optimize—solving the issue with insights traditional rank trackers miss.
Content Strategist
"You are planning the next quarter's content calendar and want to identify high-value topics where the client has search presence but not strong rankings."
Zensor's quick win report shows 28 keywords in positions 11 to 20 with over 1,000 monthly impressions each. You build Q3 content and optimization targets around this list, knowing each one has a realistic path to page one.
Frequently Asked Questions
Yes. Zensor connects to Google Search Console via the official Search Analytics API using read-only OAuth. It never modifies your GSC settings or verified properties, and access can be revoked anytime from your Google account.
Zensor imports up to 16 months of historical search data—the maximum available through the Google Search Console API—enabling immediate year-over-year analysis without waiting for new data to accumulate.
Zensor analyzes GSC query-to-page data to detect when multiple pages rank for the same keyword. It flags keyword cannibalization issues and recommends consolidation, canonical tags, or content differentiation based on the pattern detected.
Yes. Zensor syncs Google Search Console data daily and tracks position changes for every keyword. Ranking drop alerts notify your team by email when significant changes occur, enabling faster investigation and response.
Impressions show how often a page appears in search results, while clicks track how many users visit the page. CTR (click-through rate) is clicks divided by impressions. High impressions with low CTR often signal weak titles or meta descriptions—opportunities Zensor automatically flags for optimization.
Yes. GSC data can be exported as CSV for analysis or included in branded white-label PDF reports. You can also share live dashboard links so clients can access their search performance data anytime.
Manage GSC Data Across Every Client From One Dashboard
Stop switching between GSC properties one at a time. Zensor pulls search performance data across your entire client portfolio, surfaces ranked opportunities, and delivers white-label reports automatically.